Michael Yancey - Dr. Ting Cong - Week 3
Dr. Cong and I have coordinated with Dr. Ranawat for me to attend a surgery this coming Friday (6/28). Dr. Ranawat is an orthopedic surgeon, specializing in sports injuries of the joints—hip, knee, and shoulder. I look forward to the opportunity to see an orthopedic surgery in person, especially one where I can observe first-hand the kinds of cases my recent research on femoral fracture repairs could help improve.
----------------------------------
This week, I continued working with the Khormaee lab on their mesenchymal stem cell in alginate hydrogels project. There were unexpected problems with the most recent cell passage, so we were unfortunately unable to proceed to creating and imaging the hydrogels. We are currently expanding a new passage of cells until they are sufficiently confluent to create a new hydrogels on titanium. We will also be analyze prior widefield images taken of the stem cells this coming week, with the goal of obtaining cell density measurements in different regions of each analyzed gel.
----------------------------------
On the femoral subchondral fracture project, I have continued to analyze the defect volumes of our cohort of cadaveric femurs. This analysis has been completed for all femurs we had performed testing on up to this point. The following is a summary of our defect volume analysis for the femoral heads after simulated failure, after repair, and after compression of the repaired site. We also obtained a "raised volume" for each of these stages, which measures the volume of the defect site that is raised above the native surface of the femoral head—this became important to measure because there is often a significant raised volume after defect repair when the affected area is restored approximately to its original position.
- The average defect volume following simulated failure, repair, and compression of the repaired site was 1970.54±235.30 cubic mm, 46.66±61.93 cubic mm, and 412.81±363.06 cubic mm, respectively.
- The average raised volume following simulated failure, repair, and compression of the repaired site was 0 cubic mm, 75.83±58.51 cubic mm, and 2.50±5.58 cubic mm, respectively.
As noted last week, stiffness of the "toe region" of the force-displacement curve for each femoral head will be analyzed to more fully quantify the defect region response over the whole range of forces from 0 to 800N.
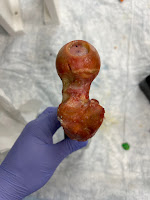
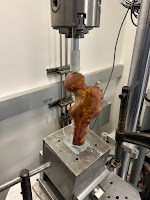
Today, Dr. Cong and I continued physical testing, completing simulated failure, repair, and mechanical testing of two more femurs. Below are three images showing various stages of the testing process.
- The top left image show the femoral head after simulated failure—each femur has a 2cm deep core removed from the femoral head, half of that core is morselized and then replaced to simulate the bone defect caused by an impaction fracture. The defect region is then loaded to 800N, approximating body weight, on an axial tensile tester to induce compressive failure in the defect area.
- The top right image shows the inside of the femoral head after repair using impaction grafting of 2cc of chain-milled allograft bone. The "cap" of the femoral head has been removed to show the allograft.
- The bottom image shows the mechanical axial testing setup where the femoral head undergoes force-controlled loading to 800N through a custom impaction anvil approximating the curvature of a 50-mm diameter femoral head.


Comments
Post a Comment